To successfully automate financial reporting, you first need to look inward, not outward. It’s about defining clear objectives and taking a hard look at your current manual workflows. This groundwork is what separates a successful automation project from a frustrating and expensive failure. It’s this strategic blueprint that ensures the technology you eventually choose solves the right problems from the start.
Building Your Foundation for Automation
Before you even think about looking at a software demo, the most important work happens inside your own organisation. I’ve seen too many businesses jump straight to technology without a clear plan, and it almost always leads to rework, frustration, and blown budgets. The initial phase of automating your financial reporting is all about strategy and introspection, not software.
This first stage means taking a deep dive into your existing processes to figure out exactly where the weak spots are. Which tasks eat up the most hours? Where do mistakes happen most often? The goal here is to create a detailed map of your current financial reporting workflows, from the first piece of data collected to the final report distribution.
Pinpointing Your Reporting Needs
Start by getting specific about your biggest reporting headaches. Most businesses I work with suffer from a few common bottlenecks that are perfect candidates for automation. These usually include:
- Manual Data Consolidation: The sheer time spent dragging data from separate systems like your ERP, CRM, and a maze of spreadsheets.
- Reconciliation Delays: That slow, painful, and error-prone job of matching transactions between different accounts or statements.
- Repetitive Report Generation: Manually building the same weekly, monthly, or quarterly reports by copying and pasting data. It’s tedious and a huge source of errors.
A critical part of this is also understanding your compliance obligations. For example, if you’re in the not-for-profit sector, you have to follow very specific standards. Getting a firm grip on nonprofit reporting requirements is non-negotiable before you build any new system.
Auditing Your Current Workflows
Once you’ve listed your pain points, it’s time for a proper audit. This isn’t just about listing tasks; it’s about quantifying their real impact. How many hours a month does the finance team really spend on manual data entry? What’s the actual business cost of a single reporting mistake? Answering these questions builds an undeniable business case for automation.
For many, the first and most obvious win is tackling data input. If you’re curious about the impact, our guide on how to automate data entry shows just how significant those initial time savings can be.
This detailed audit gives you the clarity to set goals you can actually measure. Forget vague targets like “improve efficiency.” Get specific.
Your goal should be something concrete, like “cut the month-end closing process from 10 days down to 3” or “eliminate 95% of data entry errors in our expense reporting.” These are the kinds of objectives that guide a project and truly define success.
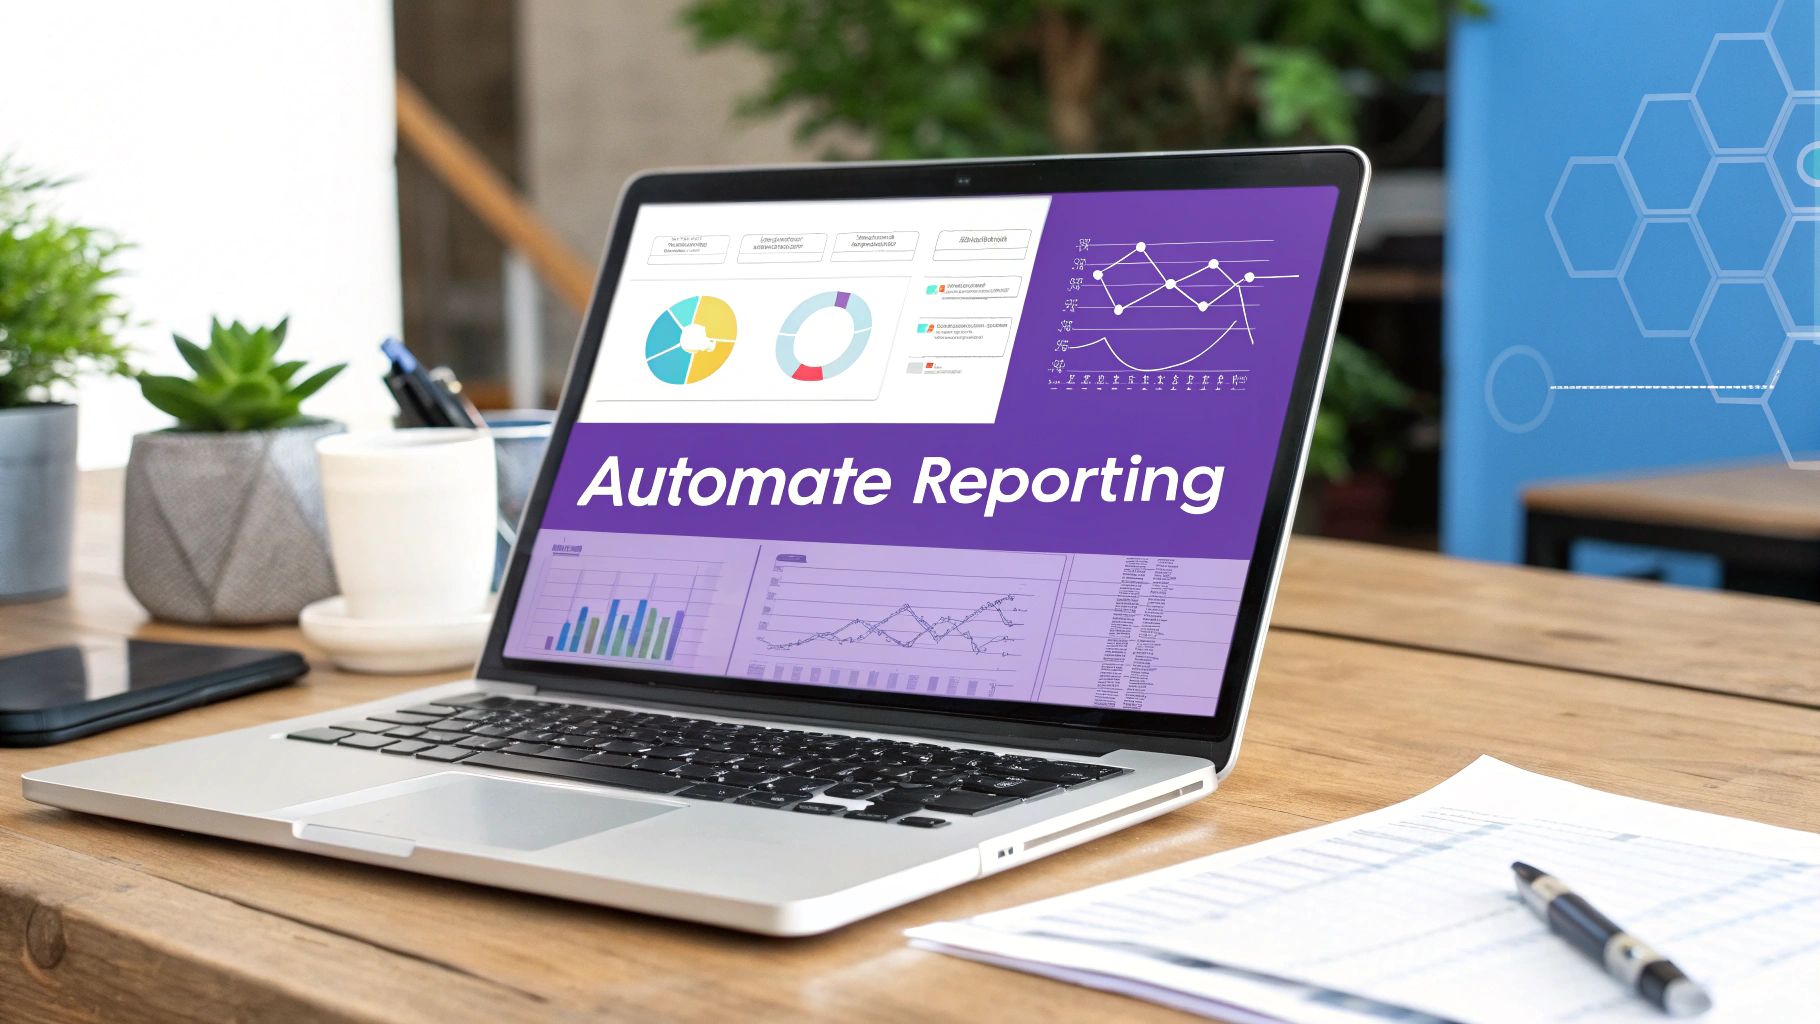
This flow chart gives you a clear picture of how automation transforms the journey from raw data to insightful reports.
The image really drives home how technology can turn a series of disconnected manual tasks into a single, cohesive process that works for you, not against you.
To see the difference in black and white, let’s compare the old way of doing things with a modern, automated approach.
Manual vs Automated Reporting Workflows
| Reporting Task | The Manual Process (Old Way) | The Automated Process (New Way) |
|---|---|---|
| Data Collection | Manually exporting data from multiple sources (ERP, CRM, Excel) and copying it into a central spreadsheet. Highly time-consuming. | Automated connectors pull data directly from source systems in real-time, eliminating manual work and delays. |
| Consolidation & Reconciliation | Finance team members spend days matching transactions, verifying figures, and chasing discrepancies between systems. | The system automatically matches and reconciles data based on predefined rules, flagging only true exceptions for human review. |
| Report Generation | Creating reports by manually updating templates, charts, and tables. One small change can mean redoing the entire report. | Reports are generated automatically on a set schedule or on-demand. Dashboards update live as new data comes in. |
| Review & Distribution | Reports are emailed as static PDF or Excel files, leading to version control issues and potential security risks. | Stakeholders access secure, interactive dashboards. Reports are distributed automatically through secure channels. |
As the table shows, the shift isn’t just about speed; it’s a fundamental change in how the finance team operates, moving them from data wranglers to strategic analysts.
Aligning Stakeholders and Regulatory Demands
Finally, all this strategic work has to consider your internal teams and external rules. Getting buy-in from finance, IT, and operations is crucial. You need everyone aligned around a shared vision for what the new system will do for the business.
On top of that, the regulatory environment is an absolute non-negotiable. Here in Australia, things are always changing. The 2025 financial reporting season, for instance, has brought in new complexities like the Global and Domestic Minimum Tax legislation. This means companies now have to meticulously calculate and disclose their Pillar Two tax obligations. ASIC also continues to keep a close eye on impairment testing, asset valuations, and other critical disclosures.
A good automated system must be flexible enough to handle these compliance demands from day one. It’s not an afterthought; it’s a core requirement of your foundation.
Selecting the Right Automation Technology
Choosing the right software stack is probably the most significant decision you’ll make when you automate your financial reporting. Get it right, and you’ll create a sharp, insightful engine for business growth. Get it wrong, and you’re stuck with an expensive, clunky system that causes more headaches than it solves. The market is absolutely flooded with options, so it can be tough to see past the marketing spin and find what truly fits your business.
The key is to walk into the selection process with a clear framework. This isn’t just about ticking off features on a list; it’s about finding a technology partner whose solution aligns with your strategic goals, plays nicely with your existing systems, and can actually grow with you.

Comparing Categories of Financial Automation Tools
First things first, you need to get your head around the main categories of software out there. Each is built for slightly different purposes, and understanding the distinction is vital for creating a sensible shortlist of vendors.
-
All-in-One ERP Systems: These are the heavyweights of business software—think platforms like NetSuite, SAP, or Microsoft Dynamics 365. They offer comprehensive financial modules as part of a much bigger platform that covers everything from inventory and operations to HR.
-
Specialised Reporting Platforms: Tools such as Workiva or FloQast are laser-focused on the financial close and reporting process. They’re designed to sit on top of your current accounting software, layering on powerful automation, collaboration, and compliance features.
-
Business Intelligence (BI) Tools: Think of platforms like Tableau or Power BI. These are data visualisation powerhouses. While not strictly for finance, they are brilliant at connecting to various data sources and creating highly customised, interactive dashboards that make financial data easy to understand.
From my experience, many businesses find a hybrid approach gives them the best of both worlds. For instance, you might use the general ledger in your ERP, connect it to a specialised reporting tool for compliance, and then pipe that data into a BI tool for your executive dashboards.
Assessing Critical Features and Capabilities
Once you’ve figured out the type of tool you need, it’s time to dig into the specific features. Don’t let a long list of functionalities dazzle you; concentrate on the ones that will actually solve your core problems.
A make-or-break consideration is how well the software pulls in data from multiple sources. Flawless ERP systems integration is simply non-negotiable if you want to achieve a single source of truth. This can get complicated, but you can get up to speed by reading our detailed guide on ERP systems integration to make sure you ask the right questions during demos.
When you’re talking to vendors, push past the sales pitch. Ask them to show you a real-world scenario that applies directly to your business. For example: “Show me exactly how your tool would consolidate data from our three international subsidiaries, each using a different chart of accounts.” How they handle that question tells you everything you need to know about the system’s real-world flexibility.
Beyond integration, here are the essential questions you need answers to:
- Customisability: How easily can we build the exact reports we need without needing a developer?
- Scalability: Will the system cope if our data volume grows by 50% over the next two years?
- Security: What specific security protocols, like encryption and role-based access controls, are actually in place to protect our sensitive financial data?
- User Experience: Is the interface genuinely intuitive for a finance professional, not just an IT expert?
The Growing Importance of AI and Predictive Analytics
The financial software space is evolving quickly, largely driven by artificial intelligence. Modern platforms are starting to move beyond just spitting out historical reports; they’re becoming predictive insight engines. This trend is particularly strong here in Australia.
Investment in AI within Australian accounting firms is projected to climb at a Compound Annual Growth Rate (CAGR) of around 42.5% through to 2027. This boom is fuelled by AI-powered software handling tasks like data entry, invoice processing, and even preliminary financial analysis. It’s a shift that lets accountants focus on high-value strategic advice.
What this means for you is that you should be actively looking for tools with built-in AI capabilities. These features can automatically flag anomalies, forecast cash flow with far greater accuracy, and even suggest areas for cost savings. Ultimately, this helps turn your finance department into a more forward-looking, strategic partner to the rest of the business. Choosing a tool with strong AI features today is a direct investment in your company’s future competitiveness.
Unifying Your Data for a Single Source of Truth
Let’s be blunt: your automated reporting system is only as reliable as the data you feed it. You can have the most sophisticated software on the market, but if it’s running on inconsistent or inaccurate information, it will generate flawed reports you simply can’t trust. This is where so many financial automation projects fall over—not because of the tech, but because the data foundation is shaky.
The usual suspect? Data silos. I see it all the time. Your financial information is probably spread across a handful of disconnected systems. The general ledger lives in the ERP, sales pipelines are tracked in a CRM, a separate platform handles payroll, and countless critical details are buried in departmental spreadsheets. When these systems don’t communicate, you don’t really have a single, cohesive business view; you have a collection of isolated data islands.

Manually pulling information from each source to assemble reports isn’t just painfully slow; it’s a recipe for disaster. One simple copy-paste error or an outdated export can throw off an entire financial statement, leading to poor strategic decisions and even compliance headaches. The goal, then, is to build a unified data ecosystem that establishes a single source of truth (SSOT).
Bridging the Gaps Between Systems
To tear down those data silos, you need to build digital bridges between your systems. This is where you’ll hear terms like APIs, connectors, and data warehousing thrown around. While they might sound like jargon reserved for the IT department, finance leaders absolutely need a practical grasp of what they do to steer the project effectively.
Here’s a quick rundown from an expert’s perspective:
- APIs (Application Programming Interfaces): Think of these as digital messengers that let different software applications talk to each other and swap data automatically. A smart setup uses an API to pull sales figures directly from your CRM into the financial reporting tool, almost in real-time.
- Connectors: These are essentially pre-built integrations designed to link popular platforms (like Xero and Salesforce, for instance). They’re often the fastest way to get two systems communicating without needing a lot of custom development work.
- A Data Warehouse: This is your central library, purpose-built to store clean, structured data from all your different sources. It becomes the ultimate source of truth, where validated information from your ERP, CRM, and other tools is organised and ready for deep analysis and reporting.
Constructing this unified data pipeline is a foundational step in modernising your finance function. If you’re thinking bigger, our guide on how to automate business processes offers a broader look at creating these interconnected workflows across your entire organisation.
Mastering Data Mapping and Cleansing
Just connecting your systems is only half the battle. Once the data starts flowing, you have to be sure it’s consistent and clean. This brings two crucial disciplines into play: data mapping and data cleansing.
Data mapping is the technical exercise of matching fields from one database to another. For example, a field labelled “Client_Name” in your CRM must be correctly matched to the “CustomerName” field in your accounting software. If the mapping is off, data gets lost or misplaced, and your reports become useless.
Data cleansing, on the other hand, is the ongoing job of finding and fixing errors, inconsistencies, and duplicates within your data. It’s about tackling common problems like:
- Spelling variations (“Aus Pty Ltd” versus “Australia PTY. LTD.”)
- Inconsistent formatting (dates showing as DD/MM/YYYY in one system and MM-DD-YY in another)
- Duplicate records for the same customer or supplier
A robust automation strategy isn’t a “set and forget” project; it demands proper governance. You have to establish clear data entry standards and validation rules right from the start. The old “garbage in, garbage out” principle is gospel here—the quality of your automated reports is directly tied to the quality of the raw data you put in.
By concentrating on unifying your data sources and maintaining strict data hygiene, you build a foundation of reliability. This ensures that when you do automate your financial reporting, the output is not just fast, but also accurate, consistent, and a true reflection of your business’s financial health.
Alright, you’ve chosen your tech stack and pulled all your data into a single source of truth. Now for the part that really matters: designing financial reports that people actually use to make decisions.
This is your chance to break free from the old way of doing things. We’re not just trying to recreate static, lifeless spreadsheets in a new program. The goal is to build interactive, insightful dashboards that tell the real story behind the numbers.
Success here boils down to one thing: translating raw financial data into clear, digestible visual information. You need to create reports that are not only accurate but also genuinely intuitive for everyone, from the board of directors right down to the department heads. This shift empowers them to explore the data for themselves, ask smarter questions, and spot opportunities without having to put in another request to the finance team.

This example from a Tableau dashboard gets it right. It’s a dynamic financial overview that combines crucial metrics like revenue, operating income, and expenses into one interactive view. It’s built for quick comprehension, letting an executive see a trend and immediately drill down to figure out what’s driving it.
Core Principles Of Effective Report Design
Before you start building anything, it’s critical to ground your work in solid data visualisation principles. When you automate financial reporting, the visual design is what makes the whole exercise valuable to the people using it. I’ve seen brilliantly engineered systems fail because the final dashboard was a cluttered, confusing mess that nobody wanted to touch.
Your main focus should always be on clarity and relevance. For every report you design, ask yourself two simple questions: Who is this for? What is the single most important question it needs to answer for them?
Here are a few key design ideas I always come back to:
- Visual Hierarchy: The most critical numbers, like Gross Profit or Net Income, have to jump off the page. Use size, colour, or prime positioning to draw the eye there first.
- The Right Chart for the Job: Stick to the basics that work. Bar charts are perfect for comparisons, line charts excel at showing trends over time, and pie charts should be used sparingly, really only for simple part-to-whole breakdowns. Resist the temptation to use a complex chart that looks fancy but requires a manual to understand.
- A Minimalist Approach: If an element doesn’t add value, get rid of it. This means stripping out unnecessary gridlines, borders, and distracting colours. Every single pixel on the dashboard should have a clear purpose.
Presenting complex information clearly is the heart and soul of effective financial reporting. It pays to explore the top financial data visualization techniques to really make your data’s story compelling and impactful.
Building Your Key Financial Reports
With those principles in your toolkit, you can start building the foundational reports every business needs. But remember, in an automated system, these aren’t static documents—they’re living, breathing dashboards.
Profit & Loss (P&L) Statement Instead of a flat table of numbers, your automated P&L should be fully interactive. A user ought to be able to click on an expense line like “Marketing Spend” and instantly see a detailed breakdown by campaign, channel, or region. This transforms a backward-looking report into a powerful, real-time tool for managing performance.
Balance Sheet An automated balance sheet can offer incredibly powerful trend analysis. You can visualise how key ratios, like the current ratio or debt-to-equity ratio, have changed over time using simple line charts. This gives stakeholders a much faster read on the company’s financial stability than trying to compare columns of numbers.
Cash Flow Statement For cash flow, nothing I’ve seen beats a waterfall chart. It can visually deconstruct the starting and ending cash balances, showing precisely how operating, investing, and financing activities moved the needle. It’s just a far more intuitive way to grasp the information compared to a traditional statement.
The real power of automated reporting is unlocked when you tailor views for different audiences. The CEO needs a high-level summary, while a sales manager needs a granular view of revenue by region. Design your dashboards with role-based views to deliver the right level of detail to the right person, automatically.
Customising Views For Different Audiences
A one-size-fits-all approach to reporting is practically guaranteed to fail. The true value of a flexible automation platform is its ability to create these bespoke views without needing to build entirely new reports from the ground up.
Think about these common scenarios I encounter all the time:
- The Executive Board: They need the 30,000-foot view, fast. Design their dashboard around major KPIs like EBITDA, net profit margin, and year-over-year revenue growth. Use big, bold numbers and simple trend lines.
- Department Managers: These people live in the operational details. A marketing manager’s dashboard should focus on campaign ROI and customer acquisition cost. An operations manager, on the other hand, needs to see inventory turnover and production costs. These dashboards all pull from the same central data but surface entirely different metrics.
- The Finance Team: Your own team needs the most granular view for analysis, reconciliation, and troubleshooting. These dashboards should allow for deep drill-downs, right to the individual transaction and general ledger entry, to make the month-end close faster and more accurate.
When you thoughtfully design reports for specific people and their specific needs, you transform the finance function from a group of record-keepers into a genuine strategic partner that provides actionable intelligence to the entire organisation.
Scaling and Optimising Your Reporting System
Getting your automated financial reporting system live isn’t the finish line; it’s the starting block. The real work—and the real value—comes from treating it as a living part of your business, something that needs to be constantly refined, optimised, and scaled. The launch is just the first step.
This final stage is all about embedding the system into your organisation’s DNA. It’s less about the tech and more about the people, the processes, and the rules you build around it. After all, what good is a perfect system if nobody trusts it or even uses it? Long-term success hinges on driving adoption and making continuous improvement a core part of your finance function.
Driving Adoption Through Effective Team Training
The single biggest factor determining your ROI is whether your team actually uses the new system. Without genuine user adoption, even the most sophisticated automation platform becomes little more than expensive shelfware.
Your training needs to be more than a quick demo of where to click. It has to be specific to people’s roles and clearly show them what’s in it for them. For your finance team, demonstrate how it slashes the time they spend on manual reconciliations. For department heads, show them how they can instantly pull their own budget vs. actuals reports, finally breaking free from those endless email chains.
A critical mistake I see is delivering generic, one-size-fits-all training. Instead, segment your users. Executives need a 30-minute overview focused on dashboards and KPIs. The core finance team needs a deep dive into report building and data validation. This targeted approach respects their time and dramatically improves engagement.
Building a Continuous Improvement Feedback Loop
Your reports and dashboards should never be considered “finished.” Your business will evolve, new strategic questions will pop up, and your reporting has to keep pace. The most successful finance teams I’ve worked with establish a formal feedback loop from day one.
This is just a simple way for users to suggest improvements, flag things that look off, or ask for new charts and tables. It could be a dedicated email inbox or a specific channel in Slack or Teams. The key is to actively manage it.
Set up a simple workflow for all feedback:
- Acknowledge: Let the user know you’ve got their suggestion and you’re looking at it.
- Evaluate: The finance or BI team assesses the request. Is it feasible? Does it align with business goals? How urgent is it?
- Act or Explain: If it gets the green light, give them a timeline. If not, explain why. This kind of transparency builds trust and encourages people to keep contributing.
This constant back-and-forth ensures your reporting system remains a valuable, relevant asset instead of a static relic.
A Framework for Troubleshooting Common Issues
Even with meticulous planning, things will go wrong. Data feeds will break. A dashboard will show a number that makes no sense. Having a clear troubleshooting framework prevents panic and helps you find the root cause methodically.
When a problem surfaces, follow a logical path:
- Isolate the problem: Is it just one report? A single user? The whole system? This first step immediately narrows down where you need to look.
- Trace the data backwards: Start at the report and work your way upstream. Check the data in the BI tool, then in the data warehouse, and finally in the source system like your ERP or CRM. This approach quickly pinpoints where the data went wrong.
- Check the connections: Broken API links and failed data syncs are incredibly common culprits. Check the logs for your integration tools to see if a scheduled job failed or threw errors.
With a structured approach like this, your team can resolve issues quickly and maintain everyone’s confidence in the system’s reliability.
Establishing Governance for Long-Term Growth
As your company grows and more people start using the system, you absolutely need robust governance. Without clear rules of the road, you’re asking for data security issues, inconsistent metrics, and a chaotic mess of reports that no one can make sense of.
Your governance plan should cover a few key areas:
- User Access Control: Be strict with role-based permissions. Not everyone needs to see sensitive payroll data or have the ability to edit core financial statements. Audit these permissions regularly and remove access for people who no longer need it.
- Data Security: Work closely with IT to make sure the entire data pipeline—from source systems to final report—meets your company’s security policies and any relevant data privacy regulations.
- Future Expansion: You need a plan for how you’ll add new data sources, onboard new departments, and handle ever-increasing data volumes. This is where choosing a scalable architecture back in the selection phase really pays off.
A forward-thinking governance framework ensures that as you continue to automate, your system remains secure, organised, and ready to support the business as it grows.
Of course, here is the rewritten section with a more natural, human-expert tone, adhering to all your requirements.
Answering Your Financial Reporting Automation Questions
Even with a solid plan in place, taking the leap to automate financial reporting always brings up a few practical questions. Over the years, I’ve found that most businesses wrestle with the same set of concerns—what it will cost, how long it will take, and what it means for their people. Let’s tackle these head-on so you can move forward with confidence.
What’s the Real Cost of Automation?
There’s no one-size-fits-all answer here. The investment needed to automate your financial reporting really hinges on your business’s size and the complexity of what you’re trying to achieve.
For a smaller business, the cost might be surprisingly low. Often, it just means switching to a higher-tier subscription on your existing accounting software, like Xero or MYOB, to unlock more advanced reporting features. The cost is essentially bundled in.
For mid-to-large companies, the picture is different. You’ll likely be looking at dedicated Business Intelligence (BI) tools or specialised reporting platforms. This kind of investment can range from a few thousand dollars to tens of thousands each year, covering software licences, implementation, and the crucial training for your team. The key is to weigh this against the ROI—think of the hours saved, the drastic reduction in errors, and the power of making smarter decisions, faster.
Will This Make Our Finance Team Redundant?
This is probably the most common fear I hear, but it’s a misconception. Automation doesn’t eliminate finance roles; it evolves them for the better. It’s designed to handle the repetitive, manual tasks that nobody enjoys—like data entry and tedious reconciliations.
By taking over the grunt work, automation frees up your finance professionals to focus on far more valuable activities. Instead of just crunching numbers, they become genuine strategic advisors. They can spend their time analysing complex data sets, modelling future scenarios, and working alongside leadership to steer the business towards growth.
The modern finance expert is no longer just a bookkeeper. They are a data analyst, a systems thinker, and a strategic partner. Automation elevates their role, making them more essential to the business, not less.
How Long Will This Take to Implement?
Your implementation timeline is directly tied to the project’s scope. If you’re a smaller business that’s just activating new features in your existing software, you could be seeing results in just a few weeks.
For a larger organisation that needs to connect multiple, often disconnected, data sources with a new BI platform, you need to be more patient. A realistic timeline for a project of this scale is typically somewhere between three to nine months. This accounts for the entire process: discovery, cleaning up your data, configuring the system, testing, and training everyone.
In my experience, a phased approach almost always works best. Start by automating a couple of core reports, like the Profit & Loss and Cash Flow Statement. This delivers tangible value quickly and builds crucial momentum for tackling more complex reporting down the track.
What Are the Biggest Hurdles to Watch Out For?
Interestingly, the biggest challenges rarely have to do with the technology itself. They’re usually rooted in foundational issues that, if ignored, can derail the entire project.
From what I’ve seen on the ground, the most common hurdles are:
- Poor Data Quality: The “garbage in, garbage out” rule is non-negotiable. If your source data is a mess, your automated reports will be just as unreliable.
- Lack of a Clear Strategy: Without well-defined goals, the project will lack direction and inevitably lose focus.
- Resistance to Change: People are naturally sceptical of new ways of working. Overcoming this inertia requires a thoughtful change management plan.
- Complex Integrations: Getting older, legacy systems to talk to new platforms can be technically tricky and often demands specialist skills.
Successfully navigating these issues comes down to having a dedicated project lead, strong support from leadership, cleaning up your data before you begin, and a solid plan for managing the human side of the change with clear communication and training.
At Osher Digital, we specialise in tackling these complexities to deliver automation solutions that genuinely work. We build the digital bridges between your systems, creating a reliable data foundation for insightful, automated reporting. To see how we can help transform your finance function, explore our business process automation services.
