8 Advanced Sales Forecasting Techniques for 2025
Discover 8 powerful sales forecasting techniques to improve accuracy. From time series to machine learning, find the right method for your business.
July 28, 2025

Accurately predicting future revenue is an essential requirement for strategic planning, resource allocation, and sustainable growth. While no method can offer absolute certainty, selecting the right sales forecasting techniques can transform abstract goals into a quantifiable, actionable roadmap. Moving beyond gut feelings or overly simplistic projections is crucial for any organisation looking to scale intelligently, manage inventory efficiently, and align its sales and marketing efforts with real-world market dynamics.
This comprehensive guide is designed for business leaders, from C-level executives to sales operations managers, who need to implement or refine their forecasting processes. We will dissect eight distinct and powerful sales forecasting techniques, moving from established statistical models to modern machine learning approaches. You won’t find generic advice here. Instead, we provide a detailed breakdown of each method, outlining its core mechanics, specific use cases, and critical pros and cons.
By the end of this article, you will have a clear framework for evaluating which forecasting models are best suited to your business context, data availability, and strategic objectives. We will explore:
- Quantitative methods like Time Series Analysis and Regression Analysis for data-rich environments.
- Qualitative approaches such as the Sales Force Composite for leveraging on-the-ground intelligence.
- Advanced AI-driven techniques that can uncover complex patterns traditional methods might miss.
This analysis will equip you to choose and implement the most effective forecasting strategy, creating a more predictable and profitable future for your organisation.
1. Time Series Analysis
Time series analysis stands as a cornerstone among quantitative sales forecasting techniques, leveraging historical sales data to project future performance. This method involves analysing data points collected at consistent intervals (e.g., daily, weekly, monthly) to identify underlying patterns, such as trends, seasonality, and cyclical movements. By understanding how sales have behaved in the past, organisations can create a statistically grounded forecast for what is likely to happen next.

The core strength of this technique lies in its objectivity; it relies on hard data rather than intuition. Pioneers like George Box and Gwilym Jenkins popularised sophisticated models that can deconstruct historical data to isolate predictable components from random noise, making it an indispensable tool for established businesses with extensive sales history.
How It Works and When to Use It
Time series analysis is most effective for businesses with a stable history and predictable sales cycles. For example, a retailer like Walmart uses it to plan for seasonal merchandise, anticipating the spike in demand for back-to-school supplies or holiday decorations. Similarly, airlines apply these models to forecast route demand, adjusting ticket prices based on historical booking patterns for specific times of the year.
This approach is ideal when:
- You have at least two to three years of clean, consistent historical sales data.
- Your market is relatively stable, without drastic, unpredictable disruptions.
- You need to forecast demand for established products, not new launches.
Actionable Implementation Tips
To effectively implement time series analysis as one of your primary sales forecasting techniques, follow these steps:
- Ensure Data Integrity: Before any analysis, scrub your data. Remove anomalies, fill in missing values, and ensure all data points are recorded at regular intervals. Inconsistent data will lead to flawed forecasts.
- Identify Components: Use statistical software (like R, Python, or tools from SAS and IBM SPSS) to decompose your data into its core components: trend (long-term direction), seasonality (predictable fluctuations), and residual (random noise).
- Select the Right Model: Choose a model that fits your data pattern. Simple models like Moving Averages work for stable trends, while more complex ones like ARIMA (Autoregressive Integrated Moving Average) can handle more intricate patterns.
- Continuously Refine: A forecast is not a one-time event. Regularly feed new sales data into your model to refine its accuracy and adapt to subtle market shifts.
2. Moving Averages
Moving averages is a foundational quantitative technique that smooths out fluctuations in historical data to reveal a clearer underlying trend. This method calculates the average of sales over a specific number of recent periods, effectively dampening the “noise” caused by random, short-term variations. By creating a series of averages, businesses can more easily visualise the true trajectory of their sales performance.

The simplicity and intuitive nature of this approach make it a widely adopted method, popularised by early statistical forecasters and embedded within modern inventory management and manufacturing planning systems. It serves as an excellent entry point into more sophisticated sales forecasting techniques, offering a straightforward way to turn raw historical data into a meaningful projection.
How It Works and When to Use It
Moving averages are best suited for short-term forecasting in relatively stable markets where the primary goal is to understand the recent trend. For example, a grocery store might use a 4-week moving average to manage stock levels for perishable goods, ensuring inventory aligns with recent consumer demand. Similarly, restaurants can use a daily moving average of customer numbers to optimise staff scheduling for the upcoming week.
This approach is ideal when:
- You need a simple, easy-to-calculate forecast without complex statistical software.
- Your primary goal is to smooth out random volatility to see the underlying trend.
- You are forecasting for a short-term horizon (e.g., the next week or month).
- Your sales data does not exhibit strong, complex seasonal patterns.
Actionable Implementation Tips
To effectively implement moving averages as one of your core sales forecasting techniques, consider the following steps:
- Choose the Right Period Length: The number of periods in your average is crucial. Use shorter periods (e.g., 3-5 periods) for volatile products to make the forecast more responsive. For stable products, use longer periods (e.g., 10-12 periods) to create a smoother, less reactive trend line.
- Test Different Averages: Don’t settle on the first period length you try. Test various lengths (e.g., 3-month, 6-month, 12-month) against your historical data to see which one produces the most accurate forecast.
- Consider a Weighted Moving Average (WMA): If recent data is more relevant to future performance, a WMA gives more weight to the most recent periods. This is particularly useful for forecasting items sensitive to current trends, like fast-fashion apparel.
- Combine with Other Methods: A simple moving average does not account for seasonality. If your sales have predictable seasonal peaks and troughs, use the moving average to establish a baseline trend and then apply a seasonal index to adjust the forecast accordingly.
3. Exponential Smoothing
Exponential smoothing is a sophisticated time series forecasting technique that assigns exponentially decreasing weights to older observations, giving more significance to recent data. It excels at capturing underlying patterns while filtering out random noise. This method is particularly powerful because it can be adapted to handle data with both trends and seasonal variations, making it a versatile tool for modern sales forecasting.
The core principle is that the most recent sales data holds the most predictive power for the immediate future. This technique was pioneered by Robert G. Brown for simple smoothing, later expanded by Charles Holt to incorporate trends, and further refined by Peter Winters to account for seasonality. This evolution has made it a staple in enterprise planning software and a key quantitative method for businesses seeking accurate, responsive forecasts.
How It Works and When to Use It
Exponential smoothing generates forecasts by calculating a weighted average of past observations, with the weights decaying exponentially as the observations get older. This makes it highly responsive to recent changes in sales patterns. For example, a global beverage company like Coca-Cola might use it to forecast regional demand, allowing them to quickly adapt production to recent sales upticks. Similarly, electronics manufacturers apply it for component planning, where recent demand shifts are critical for managing inventory.
This approach is ideal when:
- You need a forecast that quickly adapts to recent market changes.
- Your sales data exhibits a clear trend (upward or downward) and/or seasonality.
- You require a method that is less computationally intensive than complex models like ARIMA.
Actionable Implementation Tips
To integrate exponential smoothing into your suite of sales forecasting techniques, follow these strategic steps:
- Prioritise Data Quality: This method’s accuracy is heavily dependent on clean, chronological data. Before you begin, ensure your dataset is complete and free from major anomalies. Exploring various data cleansing techniques is a crucial first step.
- Select the Correct Variant: Choose the right model for your specific data. Use Simple Exponential Smoothing for data without a trend or seasonality, Holt’s method for data with a trend, and the Holt-Winters method for data exhibiting both trend and seasonality.
- Calibrate Smoothing Parameters: The smoothing constants (alpha, beta, and gamma) determine how much weight is given to recent observations. Start with values between 0.1 and 0.3 for a balanced forecast, then optimise them based on forecast accuracy metrics like Mean Absolute Error (MAE).
- Monitor and Refine: Forecasting is a continuous process. Regularly feed new sales data into your model and re-evaluate your smoothing parameters to ensure the forecast remains accurate and aligned with current market dynamics.
4. Regression Analysis
Regression analysis is a powerful statistical method that moves beyond historical sales data alone to explain why sales fluctuate. It establishes a mathematical relationship between sales (the dependent variable) and various independent variables that influence it, such as marketing expenditure, pricing strategies, economic indicators, or competitor activities. This technique quantifies precisely how a change in one factor is likely to impact overall sales performance.

The strength of regression analysis lies in its explanatory power, making it one of the most insightful sales forecasting techniques. While early concepts were developed by Francis Galton, statisticians like Karl Pearson and R.A. Fisher refined the methods, allowing businesses to build predictive models that identify the key drivers of their revenue. This enables more strategic, data-driven decision-making beyond simple trend extrapolation.
How It Works and When to Use It
Regression analysis is ideal for businesses that want to understand the cause-and-effect relationships within their sales ecosystem. For instance, a consumer goods giant like Procter & Gamble can use it to determine the return on investment for a new advertising campaign by isolating its impact from other market forces. Similarly, the automotive industry uses it to forecast sales based on factors like consumer confidence, interest rates, and fuel prices.
This approach is most effective when:
- You need to understand which levers to pull to influence sales outcomes.
- You have access to reliable data for multiple independent variables.
- Your goal is to create “what-if” scenarios, such as “What will happen to sales if we increase our marketing budget by 15%?”
Actionable Implementation Tips
To effectively implement regression analysis as one of your core sales forecasting techniques, follow these strategic steps:
- Gather Comprehensive Data: Collect clean, accurate data for both your dependent variable (sales) and all potential independent variables. A good rule of thumb is to have at least 10-15 data points for each variable you include in the model.
- Check for Multicollinearity: Ensure your independent variables are not highly correlated with each other. For example, if advertising spend and the number of sales staff both increase together, the model may struggle to distinguish their individual effects. Use statistical tests to identify and address this.
- Validate Model Assumptions: Regression models rely on several assumptions, such as a linear relationship and normally distributed residuals. Use diagnostic plots to validate these assumptions before you trust the forecast.
- Start Simple, Then Refine: Begin with a simple linear regression model (one independent variable) and progressively add more variables. Test the model’s performance at each stage to avoid unnecessary complexity and ensure each added variable genuinely improves predictive accuracy.
5. Machine Learning Forecasting
Machine learning forecasting represents the cutting edge of quantitative sales forecasting techniques, employing sophisticated algorithms to uncover complex, non-linear patterns within vast datasets. Unlike traditional statistical methods, models like neural networks, random forests, and gradient boosting can automatically identify subtle drivers of sales performance that are invisible to the human eye. This capability allows organisations to move beyond historical trend extrapolation and towards a more dynamic, predictive understanding of market behaviour.
https://www.youtube.com/embed/wfFy44Z5WhY
The power of this technique is its ability to learn and improve over time, integrating new information to refine its predictive accuracy. Its widespread adoption has been accelerated by pioneers like Google, Amazon Web Services (AWS), and Microsoft Azure, which have made powerful machine learning tools accessible to businesses of all sizes, often integrated directly into cloud platforms and CRM systems like Salesforce Einstein.
How It Works and When to Use It
Machine learning models are trained on large historical datasets that include not just sales figures but also a wide array of influential variables, such as marketing spend, competitor pricing, website traffic, weather patterns, or macroeconomic indicators. Amazon, for instance, uses advanced machine learning to forecast demand for millions of products globally, optimising inventory and logistics with remarkable precision. Similarly, fast-fashion giant Zara applies ML to predict demand for new styles, enabling rapid adjustments to its supply chain.
This approach is ideal when:
- You operate in a complex, dynamic market with multiple influencing factors.
- You have access to large, diverse datasets beyond just historical sales.
- You need highly accurate, granular forecasts for strategic planning, like inventory management or production scheduling.
- You have the technical resources (or partners) to build, deploy, and maintain these models.
Actionable Implementation Tips
To successfully leverage machine learning as one of your core sales forecasting techniques, a structured approach is crucial. For a more advanced approach to sales forecasting, consider gaining insights from predictive analytics, which often underpins machine learning models.
- Prioritise Data Quality: Machine learning models are only as good as the data they are trained on. Ensure you start with clean, high-quality, and comprehensive training data. Strong data quality management is the foundation of any successful ML project.
- Prevent Overfitting: Use robust validation techniques like cross-validation to ensure your model can generalise to new, unseen data. Overfitting occurs when a model learns the training data too well, including its noise, and performs poorly on real-world data.
- Use Ensemble Methods: Combine the predictions of several different algorithms (an “ensemble”) to create a more robust and accurate forecast. This method often outperforms any single model.
- Continuously Retrain: The market is always changing. Regularly retrain your models with the latest data to ensure they remain accurate and adapt to new patterns and consumer behaviours.
6. Sales Force Composite
The sales force composite method, also known as the collective opinion technique, is a qualitative approach that builds a forecast from the ground up. It aggregates individual sales forecasts from front-line sales representatives, who provide estimates based on their direct customer interactions, pipeline status, and granular market knowledge. This bottom-up approach leverages the invaluable, on-the-ground expertise of the team closest to the customer.
This technique capitalises on the nuanced understanding that only sales reps possess about their territories, client relationships, and specific deal probabilities. It was popularised by traditional B2B sales organisations and modernised through CRM platforms like Salesforce, which facilitate the collection and aggregation of this grass-roots intelligence, making it a powerful tool among qualitative sales forecasting techniques.
How It Works and When to Use It
The sales force composite method is particularly effective in B2B environments with long sales cycles and high-value deals where individual client relationships are paramount. For instance, an enterprise software company like Oracle relies on its account managers to forecast quarterly sales based on their deep knowledge of each client’s budget cycle and procurement process. Similarly, pharmaceutical companies use their medical sales representatives’ territory insights to project demand for new and existing drugs.
This approach is ideal when:
- Your sales team has a deep, direct, and stable relationship with customers.
- The market is complex, and individual deal nuances heavily influence outcomes.
- You are forecasting for specialised or high-ticket items, not mass-market consumer goods.
The following infographic illustrates the streamlined process of creating a consolidated forecast using this method.
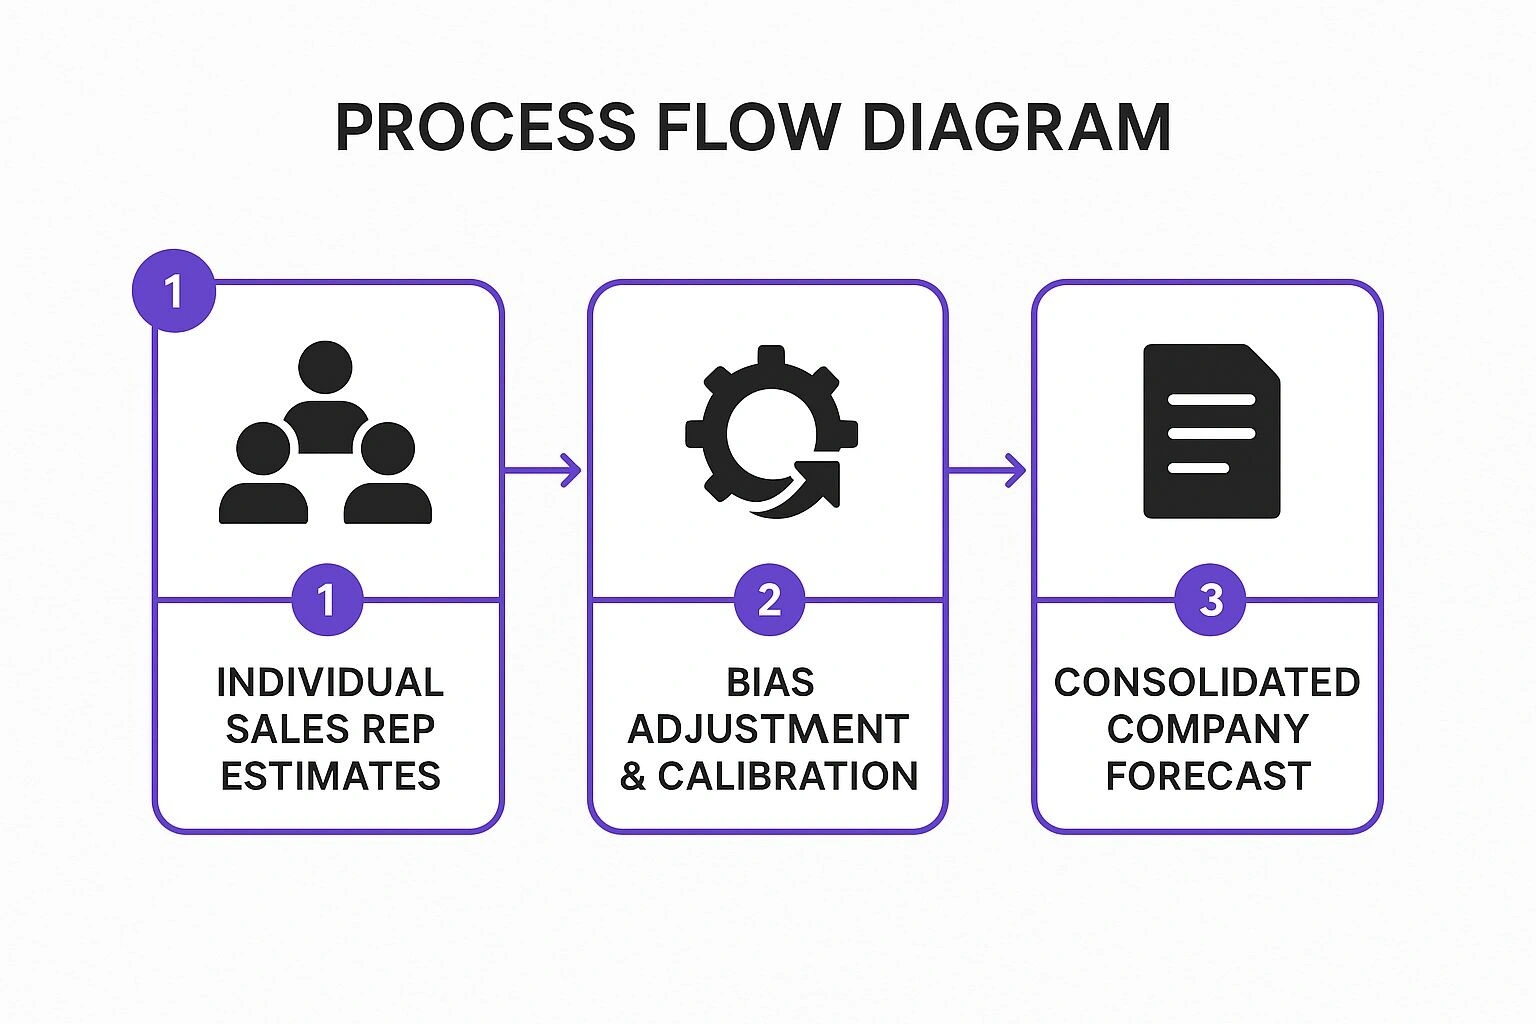
This visual process highlights that raw, individual estimates require a critical calibration step to correct for inherent biases before they can be trusted as a company-wide forecast.
Actionable Implementation Tips
To successfully implement the sales force composite as one of your core sales forecasting techniques, a structured process is essential:
- Provide Standardised Templates: Equip your team with consistent forecasting templates or CRM fields. This ensures all reps are providing data in the same format, covering deal size, probability, and expected close date, which simplifies aggregation.
- Train for Accuracy: Educate your sales team on basic forecasting principles and the importance of objectivity. Training should address common pitfalls like over-optimism or “sandbagging” (intentionally under-forecasting).
- Implement Review and Calibration: Sales managers must review individual forecasts to challenge assumptions and adjust for known biases. Compare reps’ current projections against their historical accuracy to identify patterns and make data-driven calibrations.
- Combine with Quantitative Methods: Do not use this method in a vacuum. Cross-reference the composite forecast with a quantitative method, like time series analysis, to validate the final numbers and create a more robust, balanced projection.
7. Market Research and Customer Surveys
Market research and customer surveys provide forward-looking insights that historical data alone cannot offer. This qualitative and quantitative technique involves directly engaging with customers, prospects, and market participants to gather primary data on their future purchasing intentions, unmet needs, and evolving preferences. By asking the right questions, organisations can build a forecast based on what the market says it will do, rather than just what it has done.
This approach is powerful because it captures real-time sentiment and expectations. Companies like Nielsen and Gartner have built their entire business models on providing this kind of market intelligence, a testament to its value. Similarly, the rise of accessible tools like SurveyMonkey has democratised this method, allowing businesses of all sizes to tap into direct customer feedback to inform their strategic decisions.
How It Works and When to Use It
This method is particularly valuable when historical data is scarce or unreliable, such as when launching a new product, entering a new market, or navigating a rapidly changing industry. For instance, an automotive company might use purchase intention surveys to estimate demand for a new electric vehicle model. Similarly, Netflix frequently surveys subscribers about content preferences to guide its production and acquisition strategies, directly influencing future viewership and revenue.
This approach is ideal when:
- You are launching a new product or service with no sales history.
- Your market is experiencing significant disruption (e.g., new technology, regulatory changes).
- You need to understand the “why” behind purchasing decisions, not just the “what” and “when.”
- You want to validate quantitative forecasts with qualitative, human-centric insights.
Actionable Implementation Tips
To effectively use market research as one of your key sales forecasting techniques, follow these strategic steps:
- Define a Representative Sample: Ensure your survey participants accurately reflect your target market demographics. A skewed sample will produce a skewed forecast. Your research here can even inform your broader business growth strategies.
- Ask Specific, Actionable Questions: Avoid vague inquiries. Instead of “Would you buy our product?” ask, “How likely are you to purchase Product X at a $50 price point in the next three months?”
- Account for Intent-Behaviour Gap: Recognise that what customers say they will do and what they actually do can differ. Apply a discount factor to stated purchase intentions based on historical survey accuracy or industry benchmarks. For deeper insights into gathering actionable customer feedback, which can significantly inform your forecasting models, consider exploring methods for how to get customer feedback effectively.
- Combine with Other Data: Use survey results to enrich, not replace, other forecasting models. The qualitative insights from surveys can provide crucial context to the quantitative trends identified in time series or regression analysis.
8. Leading Indicators
Leading indicators are predictive, measurable metrics that change before sales trends, offering an early warning system for future performance. Instead of relying on past sales (lagging indicators), this technique focuses on external economic factors or internal business activities that have a proven correlation with upcoming sales results. By monitoring these forward-looking signals, organisations can proactively anticipate shifts in demand and adjust their strategies accordingly.
This approach transforms sales forecasting from a reactive exercise into a proactive one. Its value has been championed by economic forecasting organisations and popularised by modern CRM and marketing automation platforms that make tracking these metrics easier than ever. Business intelligence consultants frequently implement leading indicator models to give clients a competitive edge in anticipating market movements.
How It Works and When to Use It
The method involves identifying specific activities or conditions that historically precede sales changes. For example, a construction company might monitor the number of building permits issued, as this directly signals future demand for materials and labour. Similarly, B2B software companies often track metrics like demo requests and free trial sign-ups, as these activities are strong predictors of future subscriptions.
This approach is ideal when:
- You want to anticipate market shifts rather than just react to past performance.
- Your sales are influenced by identifiable external factors (e.g., economic conditions, consumer confidence) or internal activities (e.g., marketing campaigns, website traffic).
- You need a more dynamic forecast for a rapidly changing market where historical data alone is insufficient.
Actionable Implementation Tips
To effectively use leading indicators as one of your core sales forecasting techniques, integrate the following steps into your process:
- Validate Historical Correlation: Before adopting an indicator, use statistical analysis to confirm a strong, consistent relationship between the indicator and your sales data. A perceived link is not enough; it must be data-driven.
- Use Multiple Indicators: Relying on a single metric is risky. A more reliable forecast comes from a balanced scorecard of multiple indicators. For instance, combine website traffic data with economic indices and demo booking rates for a more robust signal.
- Automate Monitoring: Set up dashboards and automated alerts in your CRM or business intelligence tool to track your chosen indicators in real-time. This ensures you can react quickly when a key metric crosses a predefined threshold.
- Combine with Other Methods: Leading indicators provide direction but often not precise figures. For best results, use them to adjust and add context to forecasts generated by other methods, like time series analysis or pipeline analysis, creating a more comprehensive and accurate outlook.
Sales Forecasting Techniques Comparison
| Method | Implementation Complexity | Resource Requirements | Expected Outcomes | Ideal Use Cases | Key Advantages |
|---|---|---|---|---|---|
| Time Series Analysis | Moderate to High (statistical modeling skills required) | Requires substantial historical data | Accurate forecasts for stable, mature products; identifies trends & seasonality | Retail, Manufacturing, Consumer Goods, Utilities | Objective, handles large datasets, detects long-term patterns |
| Moving Averages | Low (simple calculation) | Minimal historical data | Smooths data fluctuations; identifies general trends | Short-term trend identification, volatile products | Easy to implement, low computational cost |
| Exponential Smoothing | Moderate (parameter tuning needed) | Less historical data than time series | Responsive to recent changes and trends; adjusts for seasonality | Data with trends & seasonal patterns | Self-correcting, computationally efficient |
| Regression Analysis | High (statistical expertise required) | Requires substantial and high-quality data | Quantifies impact of variables; identifies cause-effect | Scenario planning, multi-factor impact analysis | Provides statistical confidence, handles multiple variables |
| Machine Learning Forecasting | Very High (specialised expertise and computing power) | Large amounts of training data; high computational resources | High accuracy for complex, non-linear patterns | Large datasets, complex relationships, real-time data | Automatic feature selection, scalable, adaptive |
| Sales Force Composite | Low to Moderate (process management and coordination) | Requires input from sales teams | Granular, customer-driven forecasts based on frontline insights | B2B sales, account-level forecasts | Incorporates market insights, quick implementation |
| Market Research & Customer Surveys | Moderate (designing and conducting research) | Expensive and time-consuming; requires sampling | Forward-looking insights on customer intentions and preferences | New product launches, market trend identification | Captures qualitative data and new customer needs |
| Leading Indicators | Moderate (requires data integration & monitoring) | Needs historical validation and real-time data | Early warning of sales changes; proactive forecasting | Strategic planning, early trend detection | Enables early action, integrates multiple signals |
Synthesising Techniques for a Robust Forecasting Strategy
Navigating the landscape of sales forecasting techniques can seem daunting, but as we’ve explored, the goal is not to find a single, perfect method. Instead, the path to accurate and reliable forecasting lies in synthesis and strategic application. From the historical precision of Time Series Analysis and Exponential Smoothing to the forward-looking insights of Market Research and Leading Indicators, each technique offers a unique lens through which to view your future revenue. The true power emerges when these lenses are combined.
Relying solely on quantitative methods like Regression Analysis might capture market trends but miss nuanced, on-the-ground intelligence from your sales team. Conversely, depending only on the qualitative Sales Force Composite method can introduce subjective biases that overlook broader economic shifts. The most sophisticated and resilient forecasting models are, therefore, hybrid models. They anchor gut feelings with hard data and validate statistical outputs with real-world context. This multifaceted approach creates a system of checks and balances, minimising the risk of being blindsided by unforeseen variables.
From Theory to Tangible Results: Your Action Plan
Mastering these sales forecasting techniques is not just an academic exercise; it’s a critical driver of organisational success. Accurate forecasts empower you to optimise inventory, allocate resources effectively, set realistic targets, and make strategic investments with confidence. Moving forward, the key is to transition from understanding these concepts to implementing them within your unique business environment.
Here are your actionable next steps to build a more powerful forecasting framework:
- Audit Your Current Process: Begin by critically evaluating your existing forecasting method. What are its strengths and weaknesses? Where are the recurring inaccuracies? Identifying these gaps is the first step toward selecting complementary techniques.
- Create a Technique Portfolio: Instead of a single method, build a portfolio. For instance, combine the stability of a Moving Average forecast (for mature product lines) with a Machine Learning model that can analyse complex variables for new market entries. Use the Sales Force Composite as a qualitative overlay to refine the quantitative outputs.
- Invest in Data Hygiene: The adage “garbage in, garbage out” has never been more relevant. The accuracy of any quantitative method, especially sophisticated ones like Regression Analysis or Machine Learning, depends entirely on the quality and integrity of your historical data. Dedicate resources to cleaning, standardising, and enriching your CRM and sales data.
- Establish a Feedback Loop: Your forecast is not a static document to be filed away. It’s a living prediction that must be continuously monitored and refined. Establish a regular cadence for reviewing forecast accuracy against actual results. Analyse the variances and use those insights to recalibrate your models and assumptions. What did you miss? Was it an overlooked leading indicator or an overly optimistic sales projection?
Ultimately, the journey toward forecasting excellence is one of continuous improvement and adaptation. The techniques you choose today may need to evolve as your business grows, your market shifts, and new technologies emerge. By embracing a blended, data-driven, and context-aware approach, you transform sales forecasting from a reactive administrative task into a proactive strategic weapon. This disciplined practice provides the clarity needed to navigate uncertainty, capitalise on opportunities, and build a scalable foundation for sustainable growth.
Ready to move beyond manual spreadsheets and unlock the full potential of your sales data? Osher Digital specialises in integrating sophisticated CRM systems and developing automated workflows that power advanced sales forecasting techniques. Let us help you build the technological foundation for more accurate, efficient, and strategic forecasting. Visit Osher Digital to learn how.
Last updated on July 1, 2026
Continue Reading
View all
Sales Automation Examples
Discover practical sales automation examples that can streamline your processes, boost efficiency, and drive revenue growth for your business.
Aug 21, 2024

How to Use Generative AI to Scale Lead Generation
Learn how to leverage generative AI to scale your lead generation efforts, improving efficiency and results in your B2B marketing strategy.
Aug 1, 2024

Automated Account Based Selling
Discover how automated account based selling can revolutionise your B2B sales process, increase efficiency, and boost conversion rates.
Jul 22, 2024
Sick of reading about automation?
Book a free 15-minute intro call. We’ll talk through what you’re trying to automate and whether we’re a good fit.