How to Set Employee KPIs Your Team Actually Uses
Employee KPIs only work when they reflect the real work. Here’s how we set, track, and review employee KPIs that move results without becoming busywork.
By Matthew Clarkson · July 20, 2025
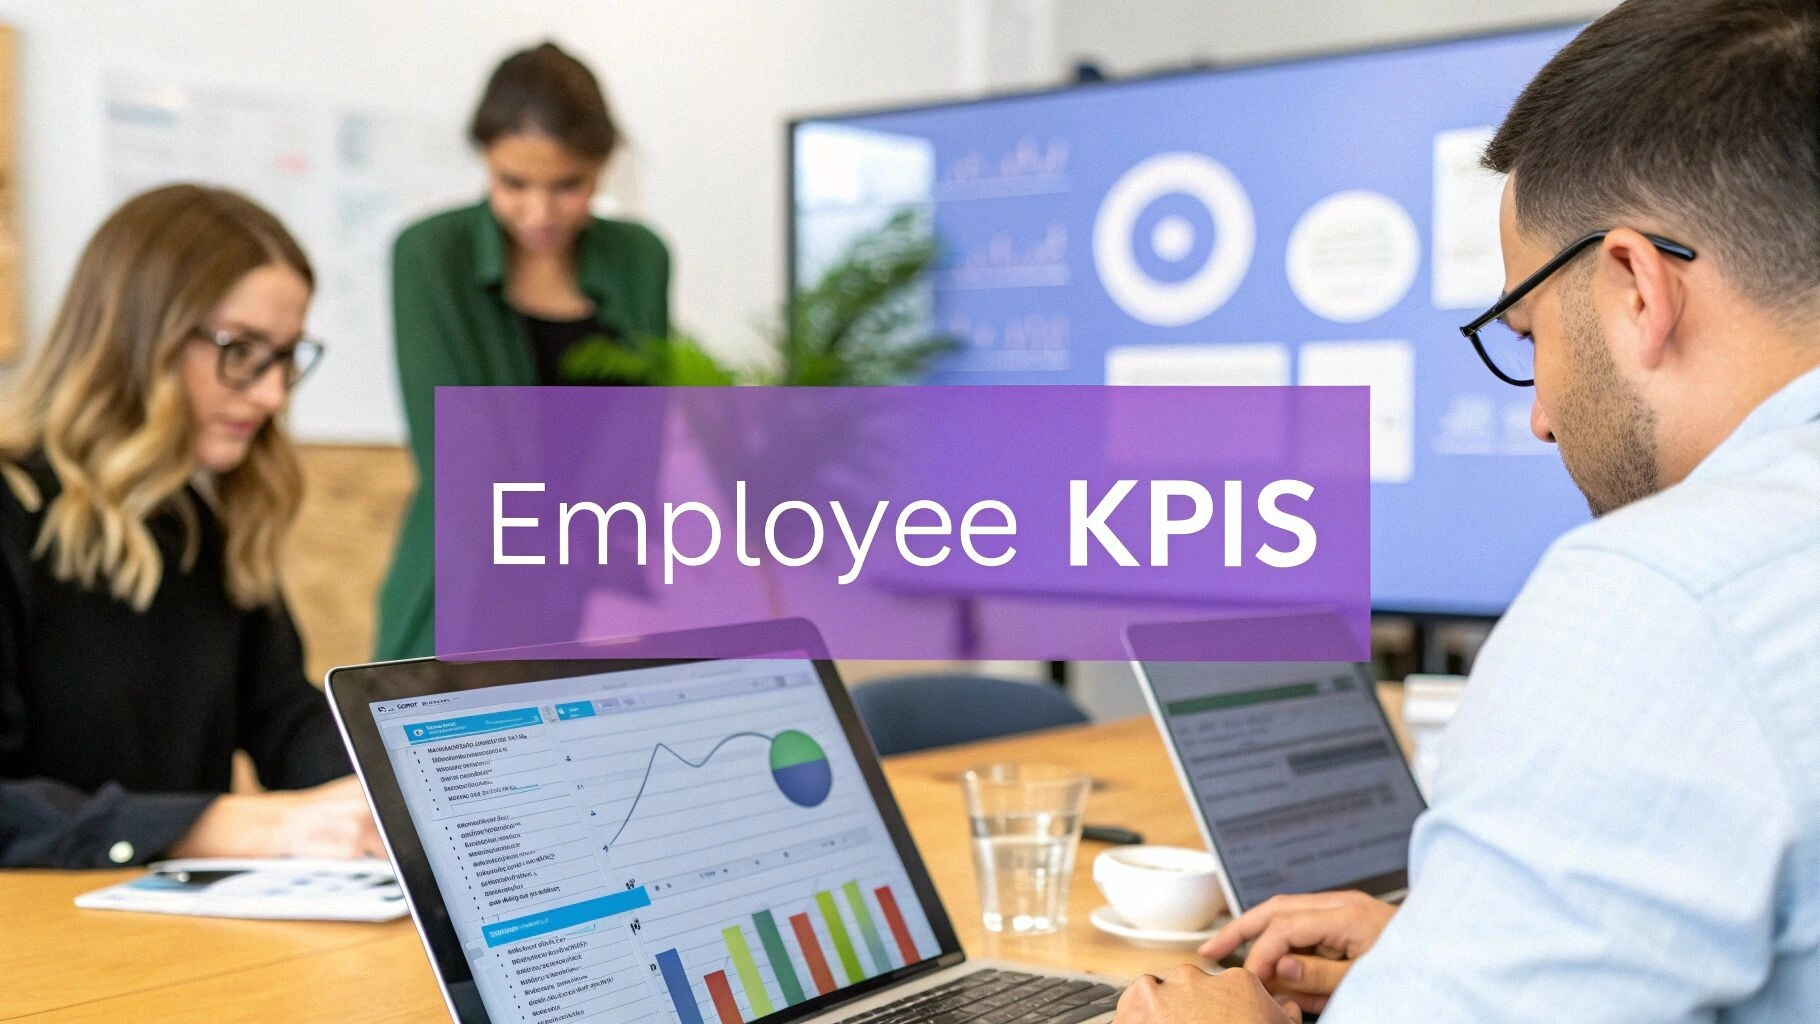
Updated May 2026. Rewritten to match the patterns we now use with operations, sales, and engineering teams, including a working set of employee KPIs and the ones we have learned to drop.
Employee KPIs (key performance indicators for employees) are the small set of numbers a team uses to know whether the work is going well. Most companies do not have a problem coming up with metrics. They have a problem picking the right five, agreeing on what they mean, and reviewing them without it becoming a ceremony nobody trusts.
We run a small AI and automation consultancy in Brisbane, and we have built the same kind of scorecards for our own team and for the teams we work with in healthcare, recruitment, and finance. This piece is a walk through how we set employee KPIs that actually get used, which ones we have stopped recommending, and what tends to go wrong when a scorecard gets dropped on a team from above.
If you want the deeper companion pieces, our guides on business process mapping and measuring automation success with KPIs sit one layer further down the same idea. This one is about the people layer.
The Trap Most Employee KPI Rollouts Fall Into
The most common failure mode for employee KPIs is not that the numbers are wrong. It is that the people doing the work were not involved in choosing them. So the metrics measure what is easy to count, not what is hard to do well. Tickets closed, emails sent, demos booked, lines of code shipped. Activity, not outcome.
The second most common failure is a scorecard with eleven numbers on it. Nobody can hold eleven things in their head. After two reviews, people start optimising for the two that get talked about in the meeting and quietly ignore the rest. The unused metrics still sit on the dashboard, which trains everyone to treat dashboards as decoration.
The third is when employee KPIs get tied directly to a bonus. The metric stops measuring the work and starts being the work. Support agents start closing tickets faster by being slightly less helpful. Salespeople stuff the pipeline with deals they know will not close. The number looks great and the underlying business gets worse.
The pattern we use to avoid all three is a tight set of three to five employee KPIs per role, chosen with the person doing the work, reviewed monthly as a conversation rather than a judgement.
Setting Employee KPIs That Match the Actual Work
Before any number gets picked, we write down a one-paragraph description of what a great month looks like for the role. Not a job description. A specific scene. “Customer support handled 380 conversations, kept first-response under two hours, and there were no Slack messages from sales saying a customer was angry about response time.”
Then we ask which numbers would make that scene visible. That is the right starting point for employee KPIs. The numbers fall out of the scene. Not the other way around.
Five Rules We Use When Choosing Employee KPIs
- Count outcomes, not activity. “Customers retained” is an outcome. “Retention emails sent” is activity. The first survives gaming. The second does not.
- Three to five per role, maximum. If you cannot remember them without checking the dashboard, you have too many.
- One quality measure for every output measure. If you track tickets closed, also track customer satisfaction on those tickets. Otherwise you are training the wrong behaviour.
- The person doing the work picks one of them. Not “approves”. Picks. This single change does more for buy-in than any communication plan.
- Review monthly, recalibrate quarterly. Annual reviews are too slow to course-correct, weekly reviews turn into theatre.
Four Types of Employee KPIs and What Each Is For
A balanced set of employee KPIs covers four angles. You do not need one of each on every scorecard. You need to know which angle each of yours covers so you can spot blind spots.
Quantitative Employee KPIs
The “how many” numbers. Deals closed, units produced, articles published, support tickets resolved, leads qualified. These are objective and easy to collect, which is why they end up dominating every scorecard ever made. They are also the easiest to game, so they need a quality companion.
Qualitative Employee KPIs
The “how well” numbers. Customer satisfaction scores, peer review ratings, code review comments per PR, content quality scores. These take more effort to collect and feel softer in a board pack, but they are what stops the quantitative metrics from rewarding bad behaviour.
Leading Indicator Employee KPIs
Inputs that predict future outcomes. Discovery calls booked this week (predicts closed deals next quarter). Hours of focused work per week (predicts engineering shipping velocity). Number of new account contacts mapped (predicts renewal risk). Leading indicators are the ones you can act on this week, which is why they belong on weekly scorecards.
Lagging Indicator Employee KPIs
Results that confirm what already happened. Quarterly revenue, annual turnover, net promoter score. These are useful for telling you whether your strategy worked, but you cannot do anything about them today. Put them on the quarterly board pack, not the monthly team scorecard.
The Five Employee KPIs We Use Most Often
These are the employee KPIs we keep coming back to in the actual scorecards we have built. None of them are clever. All of them survive contact with people who want to game them.
1. First Contact Resolution (for support roles)
The percentage of customer issues solved without a follow-up touch. We pair this with CSAT, so an agent cannot close fast at the expense of the customer. A healthy range for SaaS support is 65 to 80 percent FCR with CSAT above 4.5 out of 5.
2. Qualified Discovery Calls Per Week (for sales roles)
A leading indicator that predicts pipeline three months out. “Qualified” matters here. We define it specifically: prospect has a stated problem, a budget range, and decision authority confirmed in the call. Five qualified discovery calls a week for a B2B AE is a working baseline.
3. Cycle Time (for engineering and operations)
How long it takes a unit of work to get from “started” to “done”. On engineering teams we use PR-open to merge-to-main. On ops teams we use a ticket’s age from open to closed. Cycle time is the single number that tells you whether your process is healthy. It also forces conversations about WIP limits and review delays that nobody wants to have otherwise.
4. Monthly Active Customer Touches (for account managers)
The number of customers an account manager has had a meaningful conversation with in the last 30 days. “Meaningful” means more than a status email. This is a leading indicator for renewals. When this number drops below 70 percent of accounts, renewal risk goes up the following quarter.
5. Peer Review Rating (for most knowledge work)
A simple 1 to 5 score from peers on the quality of completed work, collected quarterly. Two to four reviewers per person. It captures the “is this person actually good to work with” dimension that no automated metric will ever pick up. The single best signal we have ever seen for who will still be a strong contributor in three years.
Where Managers and Teams Disagree on Employee KPIs
The same metric usually means different things to a manager and to the person being measured. We have watched this play out enough times that we now run a single workshop before launching any new scorecard, just to surface the disagreements.
The pattern is consistent. Managers want metrics that prove the team is busy. Team members want metrics that prove their work was valuable. These are not the same metrics. A support agent does not want “tickets per day” on their scorecard because it punishes the hard cases. The support manager does not want only CSAT because then nobody can tell whether the team is keeping up with volume.
The right answer is almost always both: an output measure plus a quality measure, weighted equally. If a manager pushes back, that is the conversation worth having before the scorecard goes live. A scorecard that survives that conversation will survive ten years of use.
The other recurring disagreement is on individual versus team metrics. We default to one team-level KPI in every scorecard, even at the individual level. It is the only thing that stops people optimising for their own number at the expense of someone two desks over. If you are mapping how cross-team work flows, our notes on system integration best practices apply directly. Same problem, different surface.
When Employee KPIs Are the Wrong Tool
KPIs are good at measuring repeatable work where you can define a clear outcome. They are bad at measuring research, exploration, creative leaps, or anything where you cannot describe the desired output in advance. They are also bad at measuring trust, judgement, taste, and most of what makes a senior person actually senior.
If you find yourself trying to write a KPI for “thinks strategically” or “is good in client meetings”, stop. You are trying to measure something that needs a human review, not a number. Use a quarterly written assessment from two or three peers instead. Faster, more useful, harder to game.
Other situations where employee KPIs are the wrong tool:
- Brand new roles. You do not know what the work looks like yet. Run the role for one quarter, then write the KPIs from what actually happened.
- Teams in the middle of a transformation. The work is changing weekly. Whatever you measure on Monday is the wrong thing by Friday. Use weekly check-ins and qualitative reviews until the dust settles.
- Specialist roles with one person doing them. The whole point of KPIs is comparability over time. A solo data engineer’s “things shipped” number is not comparable to anything. A quarterly written review from the people they support is more useful.
Tracking and Reviewing Employee KPIs Without Ceremony
The mistake that kills more KPI programmes than any other is the monthly all-hands KPI review meeting. The format is always the same. Someone presents a slide. Everyone nods. Two follow-up emails are sent. Nothing changes. People learn that the meeting is performative and start checking out.
The format that actually works is a 15-minute one-on-one between the manager and each person, monthly, on the same week. The agenda is fixed: which number is trending the right way, which is not, what does the person need from the manager to fix it. That is the whole meeting. No deck. No status report.
Quarterly, we run a longer recalibration. Are these still the right five numbers? Did anything in the business change that should change the targets? Does the team member want to swap one out? Recalibration matters because business changes faster than scorecards. A KPI that made sense six months ago might be measuring the wrong thing today.
For teams that want to automate the data collection layer, our work on AI agent development often touches this. A small agent that pulls metrics from your CRM, ticketing system, and HRIS each Friday and posts a one-page summary in Slack is two to four weeks of work and saves a manager about three hours a week. Worth a conversation if your team is hand-rolling KPI dashboards in Sheets.
Tools We Use to Track Employee KPIs
We are deliberately boring about tooling. The right tool for tracking employee KPIs is the one your team already opens every day. If that is Notion, build the dashboard in Notion. If it is Linear, use Linear’s analytics. If it is Salesforce, the dashboards in Salesforce are fine. The dashboard nobody opens is the wrong dashboard, even if it is the prettiest one in your stack.
The three patterns we see work well:
- Small teams, under 20 people: Google Sheets or Notion, updated weekly by the team lead. Free to about $20 AUD per user per month depending on tier. Friction is low, accuracy is high because the person updating it has context.
- Mid-size teams, 20 to 200: The reporting layer that comes with whatever your system of record is. Salesforce Reports, HubSpot Reports, Zendesk Explore, Linear Insights. Avoid bolting on a separate BI tool unless you already use one.
- Larger teams or multi-system rollups: A single source of truth in Looker Studio, Metabase, or PowerBI fed by a small data warehouse. Roughly $200 to $1,500 AUD per month all-in for a small finance or ops team, mostly in the warehouse compute. This only pays off above about 50 people. Below that, the BI tool is overhead.
The thing we deliberately do not recommend is a dedicated “performance management platform” if you have under 100 employees. The category exists, the products are slick, and they end up being a layer of process the team has to maintain on top of the actual work. The exception is if your HR team is on top of you to roll up performance review data for a compliance reason. In which case, fine, but be honest with the team about why you are using it.
Frequently Asked Questions About Employee KPIs
How many employee KPIs should someone have?
Three to five. Below three and you miss important dimensions of the work. Above five and people start ignoring some of them. The number that almost always works is four, with one of those being a team-level rollup the person shares with their group.
How often should we review employee KPIs?
Monthly, as a 15-minute one-on-one, with a quarterly recalibration. Annual is too slow to fix anything. Weekly turns into theatre. Monthly is the cadence where people can actually act on what they see.
Should employee KPIs be tied to bonuses?
Tying employee KPIs directly to compensation almost always corrupts them. People start optimising for the number instead of the underlying work. If you do tie compensation to performance, use a manager’s overall assessment that draws on KPIs but is not a mechanical formula. Keep the discretion human.
What are good KPIs for creative roles like design or content?
Output volume plus a quality measure. For content writers, articles published plus average peer review score. For designers, projects shipped plus stakeholder satisfaction collected per project. The trap to avoid is measuring impact metrics like “leads generated” on a content writer, because they do not own most of the levers that drive that number.
How much does it cost to track employee KPIs properly?
For a team under 20 people, between $0 and $200 AUD per month if you are using your existing tools well. For a team of 50 to 200, expect $500 to $2,000 AUD per month including BI tool subscriptions and any light integration work. Above 200, the cost is mostly the data engineering time to keep the warehouse fed, not the tool licences.
Should team and individual employee KPIs be the same?
Not exactly, but there should be overlap. Every individual scorecard should include one team-level KPI that the person shares with their group. The rest can be individual. This single change stops the worst form of internal competition where people hit their numbers at the expense of teammates.
How do you set KPIs for new employees?
For the first 90 days, do not. Use a 30/60/90 plan with milestones instead. New employees do not know enough about the role yet to be measured fairly, and you do not know enough about how they work to pick the right numbers. Run a real KPI conversation at the end of their first quarter, when both sides have data.
What is the difference between employee KPIs and OKRs?
OKRs are ambitious targets you may not hit. Employee KPIs are operating measures of how the work is going. OKRs say “increase activation rate to 40 percent this quarter”. KPIs say “activation rate, tracked monthly”. Most teams need KPIs. Fewer teams need OKRs. Running both at the same time without confusing people is harder than it looks.
If you want a second pair of eyes on your team’s scorecard, or you are thinking about pulling employee KPI data out of three different systems automatically, that is a sensible conversation to have. Get in touch and we can walk through what your team measures today and what is worth keeping.
Last updated on July 1, 2026
Free tool · 2 minutes
Automation ROI Calculator
See what a manual process is really costing you, and the payback on automating it.
Continue Reading
View all
Rented software was always a compromise. AI has ended it.
Off-the-shelf software made sense when custom cost $250,000. AI-assisted development changed the maths. Why we now build software around the business, AI-first, and connected to Claude and ChatGPT, starting at $15k.
Aug 6, 2026
n8n Outlook Automation: Where the Node Stops and Graph Begins
n8n Outlook automation breaks in predictable places: subfolders, attachments, shifting email IDs, plus the Graph API workarounds we run in production.
Mar 16, 2026

What Is a Workflow? Definition, Parts, and What Breaks
A workflow is the repeatable set of steps that takes a task from start to finish. Here is what a workflow is made of, and the parts that quietly break.
Mar 1, 2026
Sick of reading about automation?
Book a free 15-minute intro call. We’ll talk through what you’re trying to automate and whether we’re a good fit.